Competitor Analysis: Evaluating Amazon.com And Competitors In Broadline Retail Industry

In today's rapidly changing and highly competitive business world, it is vital for investors and industry enthusiasts to carefully assess companies. In this article, we will perform a comprehensive industry comparison, evaluating Amazon.com (NASDAQ:AMZN) against its key competitors in the Broadline Retail industry. By analyzing important financial metrics, market position, and growth prospects, we aim to provide valuable insights for investors and shed light on company's performance within the industry.
Amazon.com Background
Amazon is the leading online retailer and marketplace for third party sellers. Retail related revenue represents approximately 75% of total, followed by Amazon Web Services' cloud computing, storage, database, and other offerings (15%), advertising services (5% to 10%), and other the remainder. International segments constitute 25% to 30% of Amazon's non-AWS sales, led by Germany, the United Kingdom, and Japan.
| Company | P/E | P/B | P/S | ROE | EBITDA (in billions) | Gross Profit (in billions) | Revenue Growth |
|---|---|---|---|---|---|---|---|
| Amazon.com Inc | 36.35 | 7.75 | 3.69 | 5.79% | $36.48 | $78.69 | 8.62% |
| Alibaba Group Holding Ltd | 15.48 | 1.96 | 2.01 | 1.23% | $21.8 | $90.83 | 6.57% |
| PDD Holdings Inc | 11.25 | 3.24 | 2.77 | 4.59% | $16.09 | $54.73 | 10.21% |
| MercadoLibre Inc | 59.17 | 24.37 | 5.45 | 10.56% | $0.92 | $2.77 | 36.97% |
| Coupang Inc | 223 | 12.97 | 1.84 | 2.53% | $0.36 | $2.32 | 11.16% |
| JD.com Inc | 7.69 | 1.40 | 0.29 | 4.6% | $14.27 | $47.85 | 15.78% |
| eBay Inc | 18.49 | 7.16 | 3.66 | 9.95% | $0.77 | $1.86 | 1.13% |
| Ollie's Bargain Outlet Holdings Inc | 39.18 | 4.52 | 3.36 | 2.78% | $0.07 | $0.24 | 13.35% |
| Vipshop Holdings Ltd | 7.80 | 1.39 | 0.54 | 4.85% | $2.45 | $6.08 | -4.98% |
| Dillard's Inc | 12.21 | 3.71 | 1.08 | 8.97% | $0.26 | $0.69 | -1.64% |
| MINISO Group Holding Ltd | 16.14 | 3.66 | 2.23 | 3.98% | $0.65 | $1.96 | 18.89% |
| Macy's Inc | 6.09 | 0.74 | 0.15 | 0.84% | $0.31 | $2.0 | -4.14% |
| Savers Value Village Inc | 70.71 | 3.71 | 1.06 | -1.13% | $0.03 | $0.2 | 4.51% |
| Kohl's Corp | 8.61 | 0.28 | 0.07 | -0.4% | $0.23 | $1.4 | -4.41% |
| Hour Loop Inc | 168 | 10.16 | 0.42 | 11.93% | $0.0 | $0.01 | 4.68% |
| Average | 47.42 | 5.66 | 1.78 | 4.66% | $4.16 | $15.21 | 7.72% |
Through a meticulous analysis of Amazon.com, we can observe the following trends:
-
The stock's Price to Earnings ratio of 36.35 is lower than the industry average by 0.77x, suggesting potential value in the eyes of market participants.
-
The elevated Price to Book ratio of 7.75 relative to the industry average by 1.37x suggests company might be overvalued based on its book value.
-
With a relatively high Price to Sales ratio of 3.69, which is 2.07x the industry average, the stock might be considered overvalued based on sales performance.
-
The Return on Equity (ROE) of 5.79% is 1.13% above the industry average, highlighting efficient use of equity to generate profits.
-
The Earnings Before Interest, Taxes, Depreciation, and Amortization (EBITDA) of $36.48 Billion is 8.77x above the industry average, highlighting stronger profitability and robust cash flow generation.
-
Compared to its industry, the company has higher gross profit of $78.69 Billion, which indicates 5.17x above the industry average, indicating stronger profitability and higher earnings from its core operations.
-
With a revenue growth of 8.62%, which surpasses the industry average of 7.72%, the company is demonstrating robust sales expansion and gaining market share.
Debt To Equity Ratio
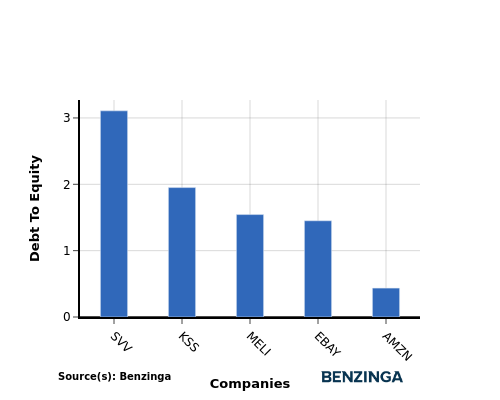
The debt-to-equity (D/E) ratio is a key indicator of a company's financial health and its reliance on debt financing.
Considering the debt-to-equity ratio in industry comparisons allows for a concise evaluation of a company's financial health and risk profile, aiding in informed decision-making.
In light of the Debt-to-Equity ratio, a comparison between Amazon.com and its top 4 peers reveals the following information:
-
When considering the debt-to-equity ratio, Amazon.com exhibits a stronger financial position compared to its top 4 peers.
-
This indicates that the company has a favorable balance between debt and equity, with a lower debt-to-equity ratio of 0.44, which can be perceived as a positive aspect by investors.
Key Takeaways
For Amazon.com in the Broadline Retail industry, the PE ratio is low compared to peers, indicating potential undervaluation. The PB and PS ratios are high, suggesting strong market sentiment and revenue multiples. In terms of ROE, EBITDA, gross profit, and revenue growth, Amazon.com outperforms its industry peers, reflecting strong profitability and growth potential.
This article was generated by Benzinga's automated content engine and reviewed by an editor.
Posted-In: BZI-IANews Markets Trading Ideas