Preview: CME Gr's Earnings
CME Gr (NASDAQ:CME) is gearing up to announce its quarterly earnings on Wednesday, 2025-07-23. Here's a quick overview of what investors should know before the release.
Analysts are estimating that CME Gr will report an earnings per share (EPS) of $2.95.
CME Gr bulls will hope to hear the company announce they've not only beaten that estimate, but also to provide positive guidance, or forecasted growth, for the next quarter.
New investors should note that it is sometimes not an earnings beat or miss that most affects the price of a stock, but the guidance (or forecast).
Past Earnings Performance
In the previous earnings release, the company beat EPS by $0.01, leading to a 0.68% increase in the share price the following trading session.
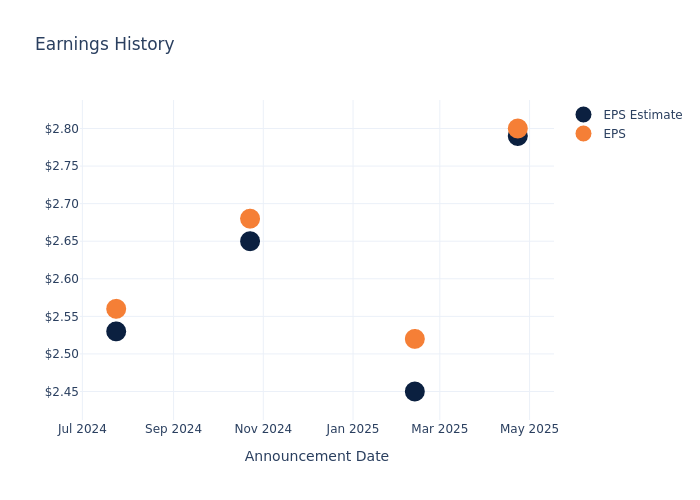
Here's a look at CME Gr's past performance and the resulting price change:
| Quarter | Q1 2025 | Q4 2024 | Q3 2024 | Q2 2024 |
|---|---|---|---|---|
| EPS Estimate | 2.79 | 2.45 | 2.65 | 2.53 |
| EPS Actual | 2.80 | 2.52 | 2.68 | 2.56 |
| Price Change % | 1.0% | 0.0% | 1.0% | 1.0% |
CME Gr Share Price Analysis
Shares of CME Gr were trading at $275.0 as of July 21. Over the last 52-week period, shares are up 39.36%. Given that these returns are generally positive, long-term shareholders are likely bullish going into this earnings release.
Analysts' Take on CME Gr
Understanding market sentiments and expectations within the industry is crucial for investors. This analysis delves into the latest insights on CME Gr.
Analysts have provided CME Gr with 10 ratings, resulting in a consensus rating of Neutral. The average one-year price target stands at $282.8, suggesting a potential 2.84% upside.
Comparing Ratings Among Industry Peers
This comparison focuses on the analyst ratings and average 1-year price targets of Intercontinental Exchange, Coinbase Global and Moodys, three major players in the industry, shedding light on their relative performance expectations and market positioning.
- Analysts currently favor an Outperform trajectory for Intercontinental Exchange, with an average 1-year price target of $199.5, suggesting a potential 27.45% downside.
- Analysts currently favor an Buy trajectory for Coinbase Global, with an average 1-year price target of $310.13, suggesting a potential 12.77% upside.
- Analysts currently favor an Outperform trajectory for Moodys, with an average 1-year price target of $522.0, suggesting a potential 89.82% upside.
Peer Analysis Summary
The peer analysis summary provides a snapshot of key metrics for Intercontinental Exchange, Coinbase Global and Moodys, illuminating their respective standings within the industry. These metrics offer valuable insights into their market positions and comparative performance.
| Company | Consensus | Revenue Growth | Gross Profit | Return on Equity |
|---|---|---|---|---|
| CME Group | Neutral | 10.38% | $1.44B | 3.53% |
| Intercontinental Exchange | Outperform | 15.28% | $1.78B | 2.87% |
| Coinbase Global | Buy | 24.23% | $1.53B | 0.63% |
| Moodys | Outperform | 7.73% | $1.43B | 17.21% |
Key Takeaway:
CME Group ranks in the middle among its peers for revenue growth, with a growth rate of 10.38%. It is at the bottom for gross profit at $1.44B. The company's return on equity is also below average at 3.53%. Overall, CME Group's performance is not leading in comparison to its peers in these key financial metrics.
Delving into CME Gr's Background
Based in Chicago, CME Group operates exchanges giving investors, suppliers, and businesses the ability to trade futures and derivatives based on interest rates, equity indexes, foreign currencies, energy, metals, and commodities. The Chicago Mercantile Exchange was founded in 1898 and in 2002 completed its IPO. Since then, CME Group has consolidated parts of the industry by merging with crosstown rival CBOT Holdings in 2007 before acquiring Nymex Holdings in 2008 and NEX in 2018. In addition, the company has a 27% stake in S&P Dow Jones Indices, making the Chicago Mercantile Exchange the exclusive venue to trade and clear S&P futures contracts. Through CME's acquisition of NEX, it also expanded into cash foreign exchange, fixed-income trading, and collateral optimization.
Financial Insights: CME Gr
Market Capitalization Highlights: Above the industry average, the company's market capitalization signifies a significant scale, indicating strong confidence and market prominence.
Positive Revenue Trend: Examining CME Gr's financials over 3 months reveals a positive narrative. The company achieved a noteworthy revenue growth rate of 10.38% as of 31 March, 2025, showcasing a substantial increase in top-line earnings. When compared to others in the Financials sector, the company excelled with a growth rate higher than the average among peers.
Net Margin: The company's net margin is a standout performer, exceeding industry averages. With an impressive net margin of 57.49%, the company showcases strong profitability and effective cost control.
Return on Equity (ROE): CME Gr's ROE is below industry standards, pointing towards difficulties in efficiently utilizing equity capital. With an ROE of 3.53%, the company may encounter challenges in delivering satisfactory returns for shareholders.
Return on Assets (ROA): CME Gr's ROA falls below industry averages, indicating challenges in efficiently utilizing assets. With an ROA of 0.64%, the company may face hurdles in generating optimal returns from its assets.
Debt Management: The company maintains a balanced debt approach with a debt-to-equity ratio below industry norms, standing at 0.13.
To track all earnings releases for CME Gr visit their earnings calendar on our site.
This article was generated by Benzinga's automated content engine and reviewed by an editor.