A Look Ahead: 3M's Earnings Forecast

3M (NYSE:MMM) is preparing to release its quarterly earnings on Friday, 2025-07-18. Here's a brief overview of what investors should keep in mind before the announcement.
Analysts expect 3M to report an earnings per share (EPS) of $2.01.
3M bulls will hope to hear the company announce they've not only beaten that estimate, but also to provide positive guidance, or forecasted growth, for the next quarter.
New investors should note that it is sometimes not an earnings beat or miss that most affects the price of a stock, but the guidance (or forecast).
Performance in Previous Earnings
The company's EPS beat by $0.11 in the last quarter, leading to a 0.2% drop in the share price on the following day.
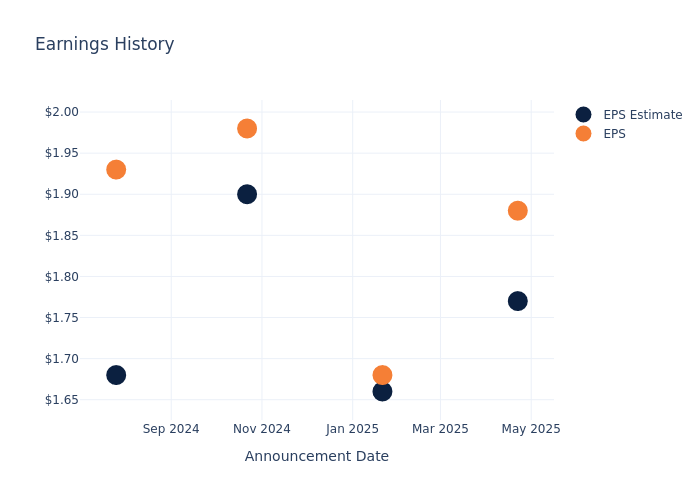
Here's a look at 3M's past performance and the resulting price change:
| Quarter | Q1 2025 | Q4 2024 | Q3 2024 | Q2 2024 |
|---|---|---|---|---|
| EPS Estimate | 1.77 | 1.66 | 1.90 | 1.68 |
| EPS Actual | 1.88 | 1.68 | 1.98 | 1.93 |
| Price Change % | -0.0% | 2.0% | -3.0% | 23.0% |
Market Performance of 3M's Stock
Shares of 3M were trading at $157.56 as of July 16. Over the last 52-week period, shares are up 51.69%. Given that these returns are generally positive, long-term shareholders should be satisfied going into this earnings release.
Analyst Opinions on 3M
Understanding market sentiments and expectations within the industry is crucial for investors. This analysis delves into the latest insights on 3M.
The consensus rating for 3M is Outperform, based on 7 analyst ratings. With an average one-year price target of $153.14, there's a potential 2.81% downside.
Comparing Ratings with Competitors
This comparison focuses on the analyst ratings and average 1-year price targets of and Honeywell Intl, three major players in the industry, shedding light on their relative performance expectations and market positioning.
- Analysts currently favor an Neutral trajectory for Honeywell Intl, with an average 1-year price target of $237.43, suggesting a potential 50.69% upside.
Summary of Peers Analysis
The peer analysis summary outlines pivotal metrics for and Honeywell Intl, demonstrating their respective standings within the industry and offering valuable insights into their market positions and comparative performance.
| Company | Consensus | Revenue Growth | Gross Profit | Return on Equity |
|---|---|---|---|---|
| 3M | Outperform | -1.03% | $2.48B | 26.87% |
| Honeywell Intl | Neutral | 7.87% | $3.79B | 8.03% |
Key Takeaway:
3M underperforms in revenue growth compared to its peer. It has lower gross profit margin. However, 3M has a higher return on equity.
Get to Know 3M Better
3M, a multinational conglomerate founded in 1902, sells tens of thousands of products ranging from sponges to respirators. The firm is well known for its extensive research and development capabilities, and it is a pioneer in inventing new use cases for its proprietary technologies. 3M is organized across three business segments: safety and industrial (representing around 44% of revenue), transportation and electronics (36%), and consumer (20%). The firm recently spun off its healthcare business, now known as Solventum. Nearly half of 3M's revenue comes from outside the Americas.
Unraveling the Financial Story of 3M
Market Capitalization Analysis: The company's market capitalization is above the industry average, indicating that it is relatively larger in size compared to peers. This may suggest a higher level of investor confidence and market recognition.
Decline in Revenue: Over the 3 months period, 3M faced challenges, resulting in a decline of approximately -1.03% in revenue growth as of 31 March, 2025. This signifies a reduction in the company's top-line earnings. As compared to competitors, the company surpassed expectations with a growth rate higher than the average among peers in the Industrials sector.
Net Margin: 3M's financial strength is reflected in its exceptional net margin, which exceeds industry averages. With a remarkable net margin of 18.74%, the company showcases strong profitability and effective cost management.
Return on Equity (ROE): 3M's ROE surpasses industry standards, highlighting the company's exceptional financial performance. With an impressive 26.87% ROE, the company effectively utilizes shareholder equity capital.
Return on Assets (ROA): The company's ROA is a standout performer, exceeding industry averages. With an impressive ROA of 2.8%, the company showcases effective utilization of assets.
Debt Management: The company maintains a balanced debt approach with a debt-to-equity ratio below industry norms, standing at 3.15.
To track all earnings releases for 3M visit their earnings calendar on our site.
This article was generated by Benzinga's automated content engine and reviewed by an editor.