Where's the Brillo ?
Since my report of January 19th, 2010 one could say that AA really needs some "brillo" as the stock price has really gotten "tarnished". This review is for those who read and perhaps acted on the suggestion in my report " Tarnished Aluminum" to short AA at the $15.50 level.
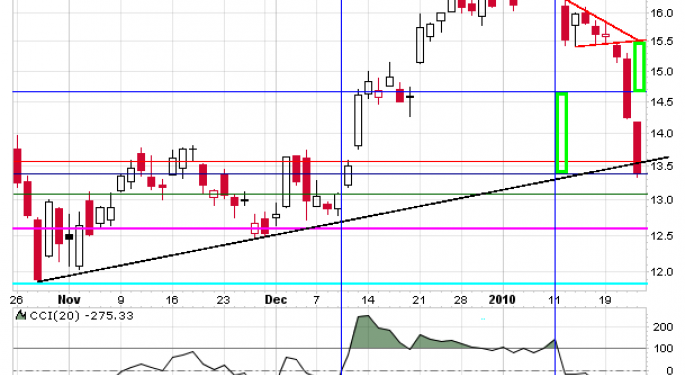
Briefly the short action was based on interpretation of a short term triangle pattern [ shown on chart ] that gave an potential downside move of $0.83 to an initial target level of $14.67 .
The short would have been initiated on January 20th and the initial target level [ blue horizontal trend line and the upper vertical green column ] achieved on January 22nd. By the end of the session on January 23rd the stock price dropped another $1.27 closed at $13.40 [ . Exiting at that price would have resulted in a gain of $2.10 or 13.5% per share in just three days.
For those who believe that the downside action is not complete I offer the following.
There is a reasonable chance that there will be a minor correction to the upside after a further drop to a potential support level at 13.09. There is a small Gap [ 14.18 - 14.22 ] that could be an upside target if the Markets really rally. Before that level the potential Resistance levels are 13.53 - 13.73 - 14.05 . The level 14.21 is a Resistance level that may play a part in a upside correction. So should there be a normal upside correction the price rise should halt at or about 13.73. If the rise is like a "charging wounded grizzly" and goes for the Gap then it could rise to 14.31 .
To the downside the potential support levels are 13.09 - 12.69 - 12.38 and 11.86.
The choice of a Stop Loss I leave up to you for that is something that can only be decided by each investor. It just depends on how much of the gain of $2.10 you wish to retain.
The following are the calculated Daily Resistance and Support Levels for 1-25-2010.
RESISTANCE
- DR4- 16.19
- DR3- 15.34
- DR2- 14.49
- DR1- 13.94
- DS1- 13.09
- DS2- 12.79
- DS3- 11.94
- DS4- 11.09
DEFINITIONS
- DR
- Daily Resistance Levels
- DS
- Daily Support Levels
© 2025 Benzinga.com. Benzinga does not provide investment advice. All rights reserved.
Posted-In: GAP Short support and resistance levels trend lineShort Ideas Technicals Markets Trading Ideas


