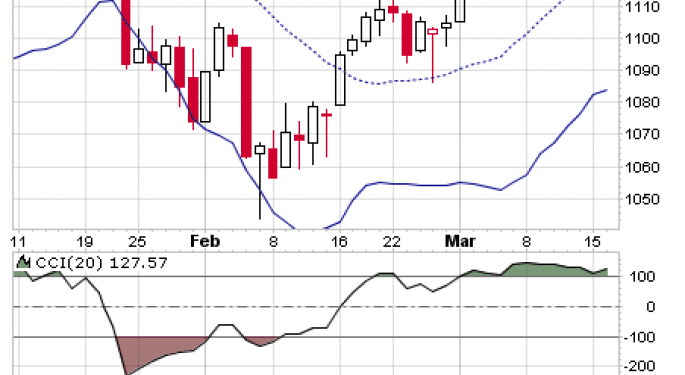
S&P 500 Large Cap Index ( SPX )
Have a Happy St Paddy's Day One and All
The S&P Large Cap Index ( NYSE:$SPX ) took a big step in the direction of reaching the terminal point of this Bear Market Rally . It will be fitting that the Top will come, I believe, on St Paddy's Day and also a Fibonacci 377 days since the March 6 , 2009 Low where this corrective leg began .
With the close at 1159.46 the initial resistance will be the zone defined by 1161 - 1162.43 . If the Index clears the "zone" then 1172 probably will be the final target for the termination point. We may even see a "kiss of death" reversal at the Top.
The RSI(14) is at 73.19 . The CCI resumed its upward rise closing at 127.57 while the Fast STO is "pushing the envelope" at 98.90 / 96.51 . Perhaps once 1162.43 is cleared there will be a "surge" where the UBB will finally be touched eliminating the final hurdle preventing the major reversal.
To the downside the initial support will be the zone defined by 1154.39 - 1153.11 . Then levels 1148 and 1139 will be the potential support levels.
I'm sure that the PPT will be very active tomorrow in trying to make sure that it is a very big positive day . Obama ( must be desperate ) would not want a back drop of Markets dripping in red as he goes on Fox News to deliver his sales pitch.
However it will be interesting to see what happens with the Futures during and after the sales pitch. I think they will head south .
The ETF S&P 500 SPDRs (NYSE: SPY) will also see an upward surge. The initial resistance will be at 116.79 and then 117.17 . THe level 117.59 is a projected target for the Top .
To downside the initial support will be the "zone" 115.94 to 115.11.
The compiled Support and Resistance data for the Index and ETF is given below.
S&P 500 Large Cap Index ( $SPX )
Resistance and Support Levels
- F- 1187.75
- R4- 1186.49
- R3- 1176.56
- CT- 1172.41
- PT- 1172
- F- 1170.25
- F- 1167.27
- R2- 1166.63
- F- 1165.35
- R1- 1163.04
- F- 1162.43
- PT- 1162
- F- 1161
- DC- 1159.46
- PT- 1154.39
- CT- 1153.94
- S1- 1153.11
- ACLB- 1148
- S2- 1146.77
- S3- 1136.84
- S4- 1126.91
- FC- 1086
- FC- 1044
- FC- 978
================
S&P 500 SPDRs ETF ( SPY )
Resistance and Support Levels
- T2- 120.27
- R4- 119.23
- FT- 118.62
- FP- 118.51
- R3- 118.20
- FT- 117.59
- R2- 117.17
- R1- 116.79
- DC- 116.41
- T1- 115.94
- S1- 115.76
- S2- 115.11
- S3- 114.08
- FC- 113.28
- S4- 113.05
- TR- 111.63
- TR- 108.93
- TR- 104.57
- TR- 97.52
© 2025 Benzinga.com. Benzinga does not provide investment advice. All rights reserved.
Posted-In: CCI ETFBroad U.S. Equity ETFs Technicals Pre-Market Outlook Intraday Update Markets ETFs


