5 Homebuilding Stocks To Considering Selling On Copper Tariff Threats

President Donald Trump is back on his trade war horse, announcing plans to implement 50% tariffs on imported copper on August 1st. While the chance of this 50% number being the final rate is slim, given past tariff climbdowns, copper tariffs would present a new headwind to an industry that's already fighting discouraging trends: homebuilders.
That’s because copper is used in a wide array of construction necessities, such as:
- HVAC systems
- Water pipes
- Electrical wiring
- Roofing foundations
- Appliance components
With mortgage rates still at their highest in decades and other tariffs on lumber and steel already weighing on the construction industry, homebuilders may struggle to withstand another blow, let alone a knockout punch like 50% tariffs on copper. It’s worth noting that more than 60% of the copper used in the U.S. is imported.
Adding insult to injury is a slowdown in home price growth (just 1.3% in June, the lowest in two years), with outright declines in markets in the South and West. Homebuilders are under pressure, and these five stocks could be assets to avoid this summer.
Market Pressure Is Building—Matt Maley's Trading Plan Is Ready
The perfect storm is forming: earnings momentum, rising tariff threats, and a Fed wildcard. Matt Maley is tracking fast-moving setups and quietly oversold names that could pop—and on Sunday at 1:00 PM ET, he's revealing it all. Don't wait for headlines to hit. Grab your spot HERE before this session fills up.
Here are five homebuilding stocks to consider selling due to the latest tariff threat.
D.R. Horton
D.R. Horton (NYSE:DHI) is no stranger to housing headwinds, as the company missed on EPS and revenue and revised down its full-year 2025 guidance projections during its April earnings report. The quarterly EPS figure of $2.58 represented a dip of more than 25% year-over-year (YoY). Despite a vast portfolio and a diverse market across 36 states, the largest U.S. homebuilder by volume received multiple downgrades and lowered price targets following its earnings release. The chart below suggests more potential trouble ahead.
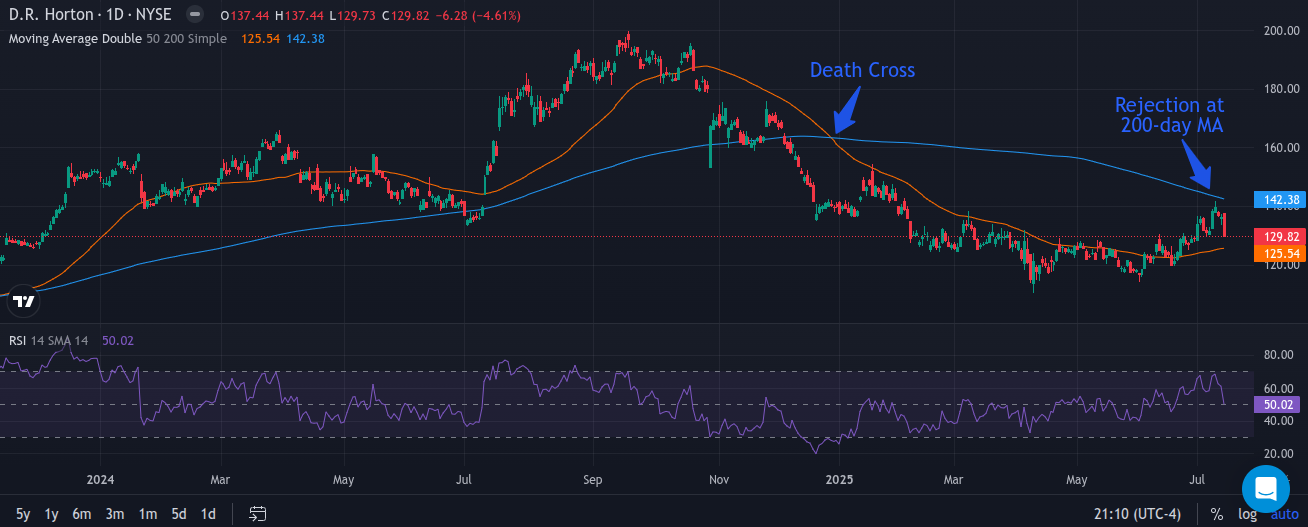
The dreaded Death Cross formed on the daily chart just before the calendar flipped to 2025, and the stock is currently down more than 6% year-to-date (YTD). Investors hoping the stock had found a bottom were likely dismayed by the price rejection at the 200-day moving average. The Relative Strength Index (RSI) has returned to its May levels. Unless shares can puncture the 200-day MA, the price momentum will likely continue to tilt to the downside.
M/I Homes
M/I Homes (NYSE:MHO) has evolved from a small regional firm into a $3 billion company, focusing on single-family homes in markets across 13 states. However, the Southern market in Florida and the Carolinas has been looking shakier lately, and the company's Q1 2025 results were an ugly miss on both EPS and revenue. The $976 million revenue figure was the lowest since Q3 2023 and represented a YoY decline of more than 7%. M/I also runs tighter margins than larger competitors, such as D.R. Horton and Lennar, giving it less room to absorb tariff costs.
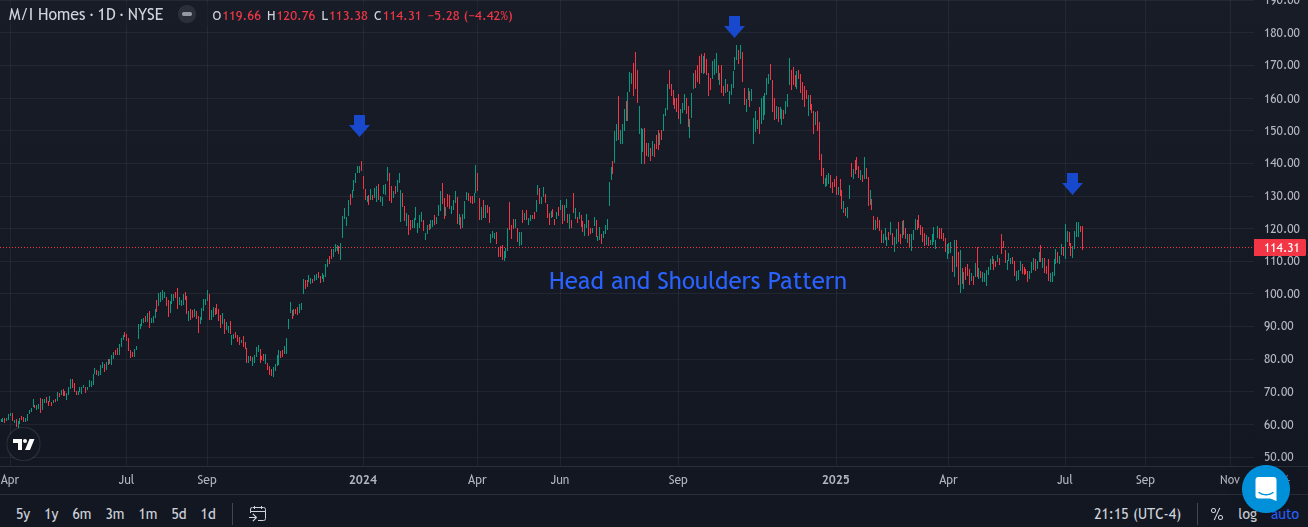
Another dreaded bearish signal has appeared on the MHO chart as well, the Head and Shoulders pattern. The Head and Shoulders is a trend reversal signal characterized by two similar peaks sandwiched between a higher peak, with the ‘neckline' acting as a potential support level. This pattern on the MHO chart suggests that the price may drop back under the neckline around the $100 level, and possibly further if support can't hold.
PulteGroup
PulteGroup (NYSE:PHM) is a homebuilding behemoth with a $22 billion market cap, nearly $18 billion in annual sales and operations across the country. PHM posted a top and bottom line beat on its Q1 2025 earnings report, but that didn't stop analysts from lowering their price targets as new orders fell 7% YoY and the company reduced its home delivery guidance to under 60,000 and trimmed gross margin expectations for the second half of 2025.
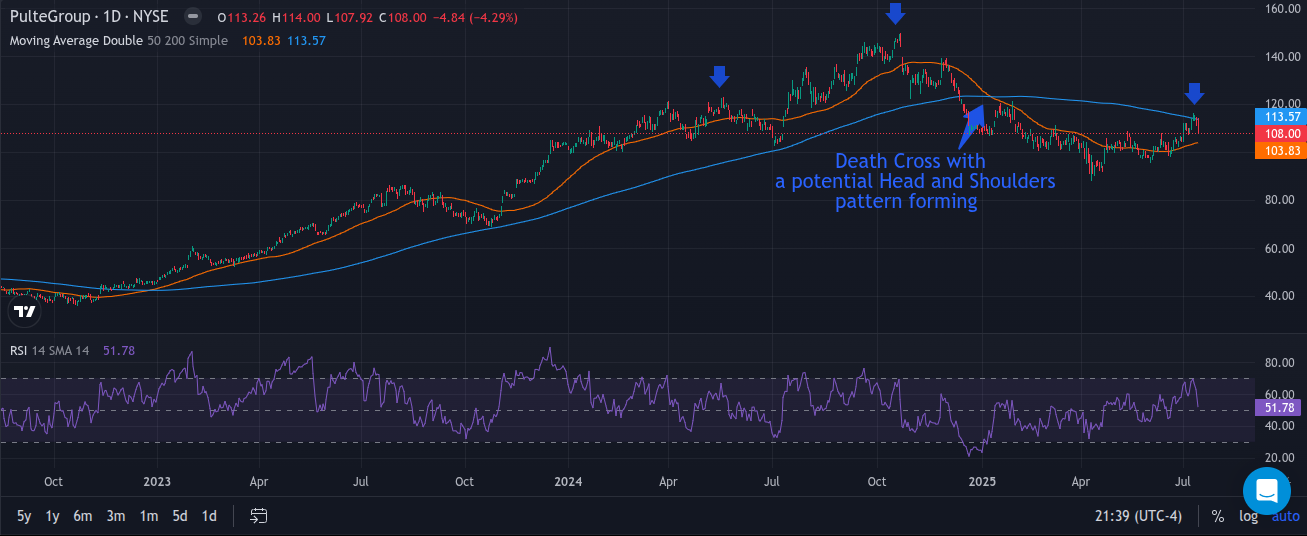
The PHM chart shows a double whammy: a Death Cross plus a Head and Shoulders pattern indicating a potential reversal in the long-term uptrend. The stock's upward advancement was recently rejected at the 200-day MA as the RSI briefly hit the Overbought threshold of 70. PHM has an earnings catalyst approaching on July 22 that investors should closely monitor.
Lennar Corp.
Second in size only to D.R. Horton, Lennar (NYSE:LEN) builds homes across the United States, with annual sales exceeding $35 billion. Lennar's diversified portfolio and focus on affordable, first-time single-family homes leave it somewhat more susceptible to tariffs and market-specific slowdowns in the West and South. Lennar reported Q2 earnings in June, missing EPS expectations while beating revenue projections. However, the revenue figure represented a more than 4% YoY drop, and gross margins continue to compress.
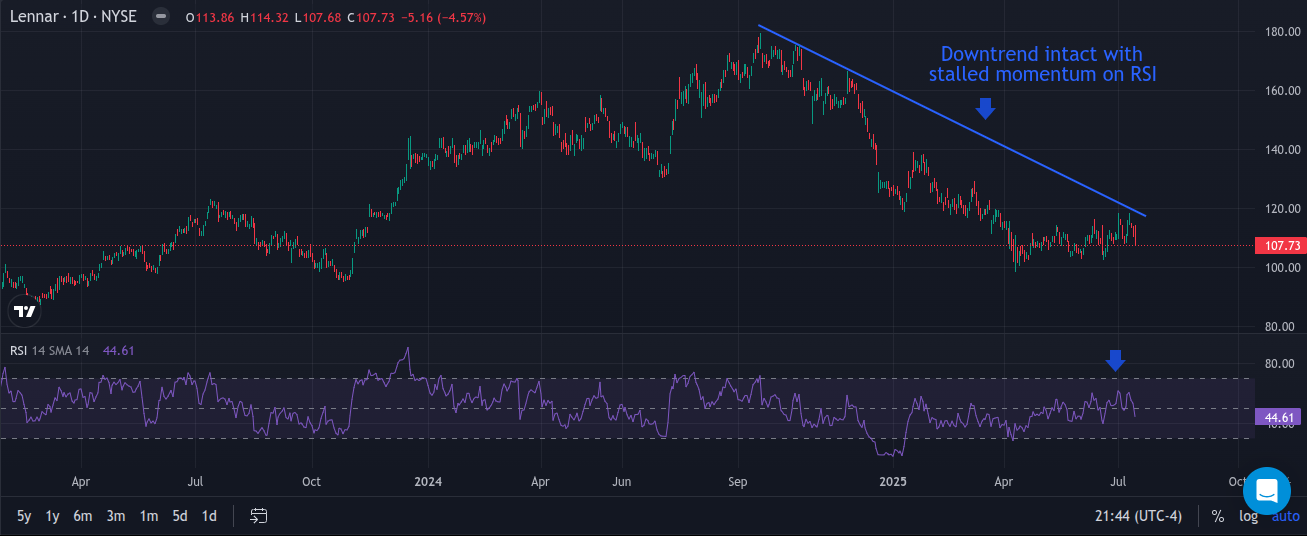
LEN shares have been rangebound since the worst of Trump's tariffs were postponed, but there's evidence the next big move will be a downward one. The downtrend that began last September has lost steam but remains intact, and the RSI indicates that any potential reversal momentum is weakening. Long-term downtrends often require volume and momentum to break, and the LEN chart is currently showing the opposite.
Ferguson Enterprises
As the largest U.S. plumbing supplier and second-largest HVAC equipment supplier, Ferguson Enterprises (NYSE:FERG) is a “‘picks and shovels'” homebuilding play that could be hit especially hard by copper tariffs. Copper is incorporated into nearly every product Ferguson manufactures and distributes. While it has a steady business segment in commercial projects, its heavy reliance on residential homebuilding customers could put significant pressure on the company's gross margins.
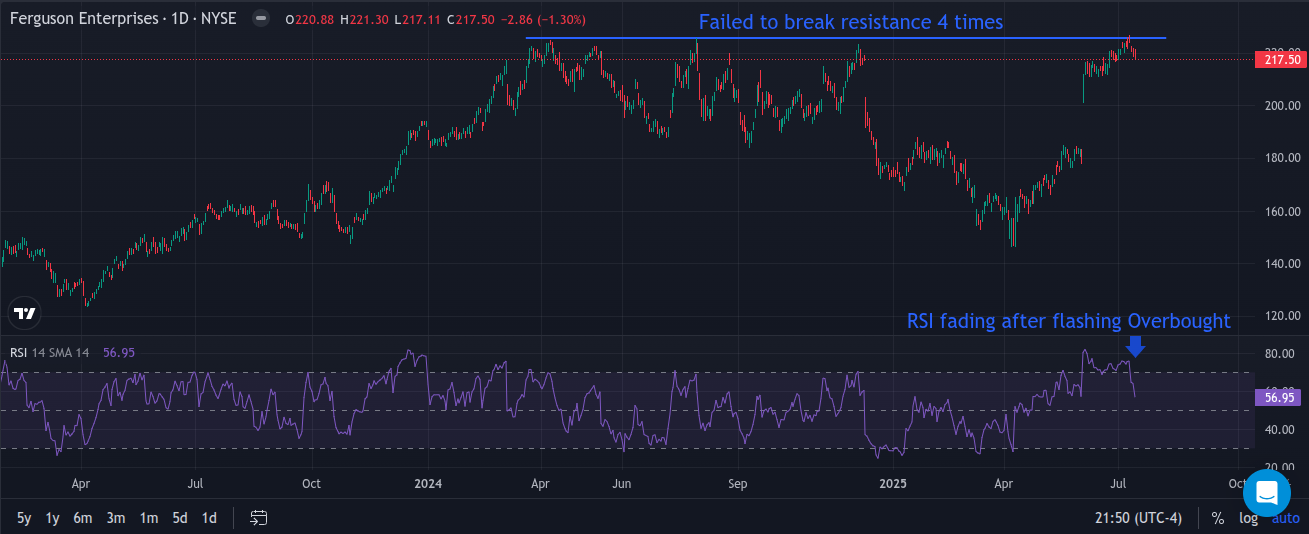
FERG may also have the most concerning chart of any company on our list today. After nearly doubling in 2023, the stock stalled repeatedly around the $215 level throughout 2024. This pattern has unfortunately continued into 2025, with the stock getting stuck at the same resistance level a fourth time following a post-tariff rally into July. The RSI also indicates fading momentum following an Overbought signal, a trend shift that may not be reflected in the stock's current price. A gap fill back to $180 in the next few weeks wouldn't be surprising considering recent history.
Editorial content from our expert contributors is intended to be information for the general public and not individualized investment advice. Editors/contributors are presenting their individual opinions and strategies, which are neither expressly nor impliedly approved or endorsed by Benzinga.
Photo: Shutterstock
Posted-In: Expert IdeasOpinion Trading Ideas