GBP/USD Is Technically Bearish In The Near Term, Poised To Retest August Monthly Low

The following post was written and/or published as a collaboration between Benzinga’s in-house sponsored content team and a financial partner of Benzinga.
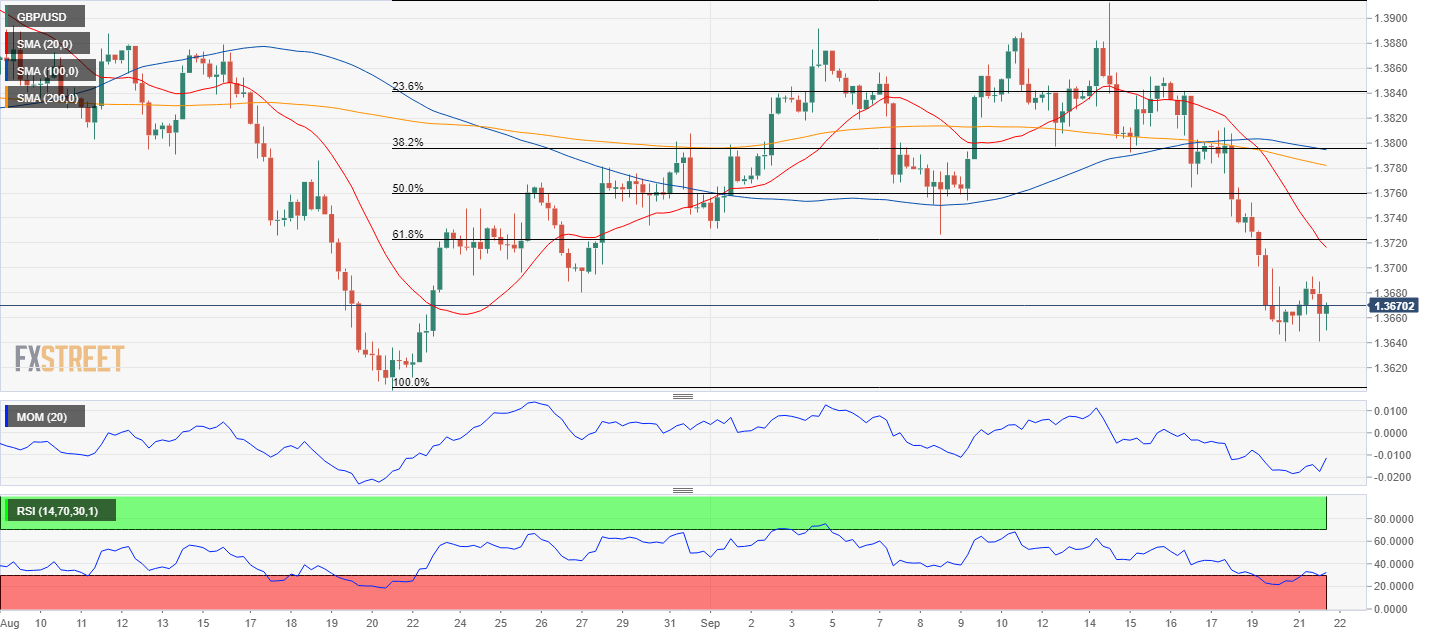
GBP/USD Current price: 1.3670
- The US Federal Reserve and the Bank of England will make announcements this week.
- UK public inflation expectations are up for this year and the upcoming ones.
- GBP/USD is technically bearish in the near term, poised to retest August monthly low.
The GBP/USD pair traded as high as 1.3692 but ended the day barely up in the 1.3670 price zone. Demand for the American currency decreased throughout the first half of the day on the back of the better performance of equities, reflecting reduced concerns. Wall Street opened with substantial gains but trimmed most of them ahead of the close, helping the greenback recover some ground.
Generally speaking, market participants were cautious ahead of the US Federal Reserve monetary policy announcement. Policymakers are widely anticipated to hold their fire, although they could provide fresh hints on tapering. The timing of the latter will set the tone for the greenback in the following sessions.
Meanwhile, and according to YouGov, UK public inflation expectations have risen to 4.1% from 3.1%, while expectations for the next 5 to 10 years are up to 3.8$ from 3.4% previously. The Bank of England is having a monetary policy meeting on Thursday. The UK reported August Public Sector Net Borrowing, which increased by £19.78 billion, much worse than anticipated. The UK won’t publish relevant macroeconomic data on Wednesday.
GBP/USD short-term technical outlook
The GBP/USD pair keeps trading near its September low at 1.3639, and the near-term picture indicates that the risk is skewed to the downside. In the 4-hour chart, a sharply bearish 20 SMA remains well above the current level and converging with the 61.8% retracement of the latest daily advance at around 1.3710. Technical indicators, in the meantime, resumed their declines near oversold readings, in line with another leg lower. A test of 1.3600 is on the cards, while a break below the level should lead to a steeper decline.
Support levels: 1.3640 1.3600 1.3550
Resistance levels: 1.3710 1.3760 1.3805
Image by Thanks for your Like • donations welcome from Pixabay
The preceding post was written and/or published as a collaboration between Benzinga’s in-house sponsored content team and a financial partner of Benzinga. Although the piece is not and should not be construed as editorial content, the sponsored content team works to ensure that any and all information contained within is true and accurate to the best of their knowledge and research. This content is for informational purposes only and not intended to be investing advice.
This article was submitted by an external contributor and may not represent the views and opinions of Benzinga.
© 2025 Benzinga.com. Benzinga does not provide investment advice. All rights reserved.
Posted-In: FXStreet GBP Partner ContentNews Eurozone Global Markets General