Cigna Group Options Trading: A Deep Dive into Market Sentiment

Financial giants have made a conspicuous bearish move on Cigna Group. Our analysis of options history for Cigna Group (NYSE:CI) revealed 17 unusual trades.
Delving into the details, we found 23% of traders were bullish, while 64% showed bearish tendencies. Out of all the trades we spotted, 13 were puts, with a value of $765,142, and 4 were calls, valued at $432,675.
Projected Price Targets
After evaluating the trading volumes and Open Interest, it's evident that the major market movers are focusing on a price band between $300.0 and $340.0 for Cigna Group, spanning the last three months.
Volume & Open Interest Development
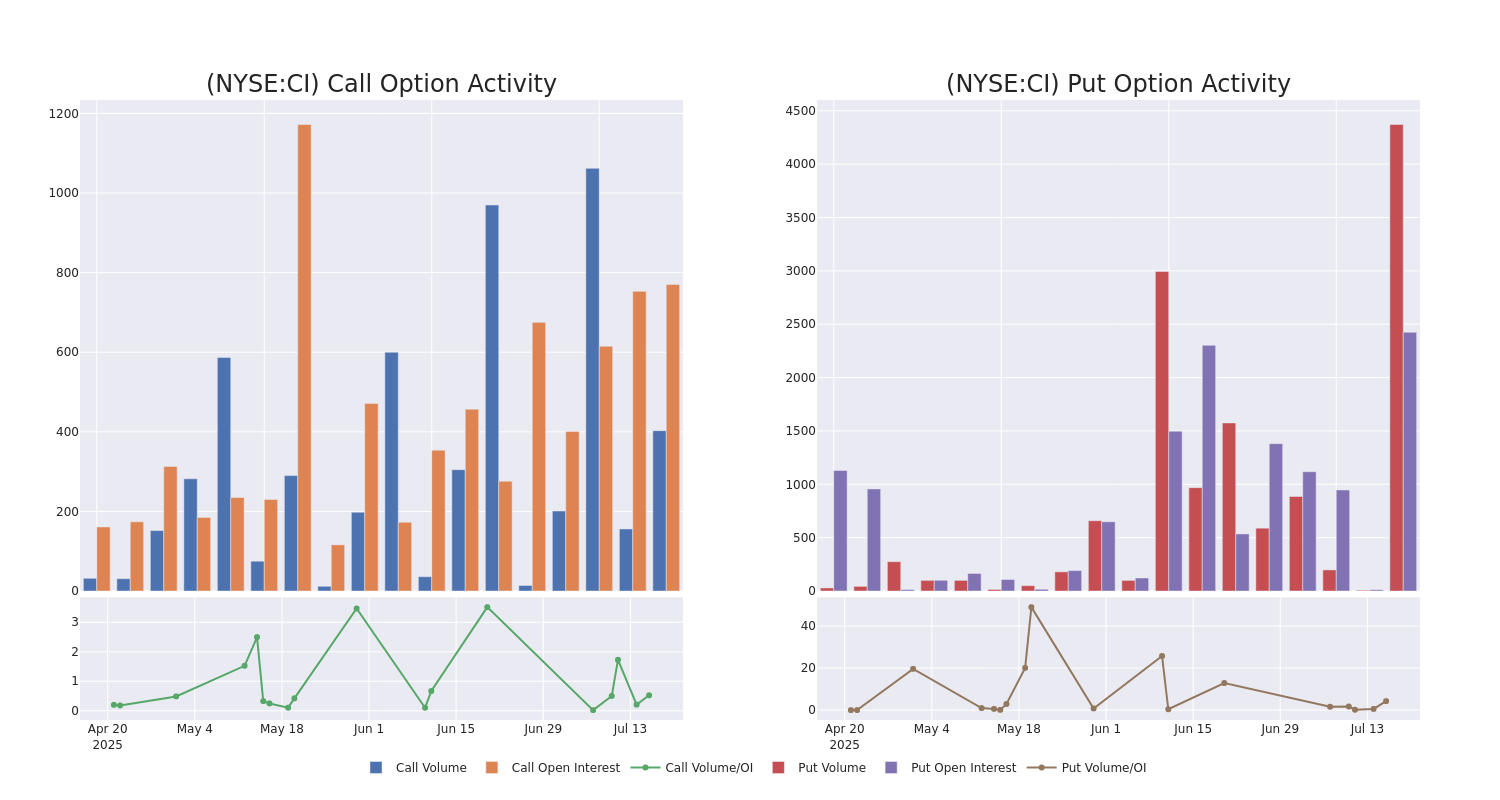
Assessing the volume and open interest is a strategic step in options trading. These metrics shed light on the liquidity and investor interest in Cigna Group's options at specified strike prices. The forthcoming data visualizes the fluctuation in volume and open interest for both calls and puts, linked to Cigna Group's substantial trades, within a strike price spectrum from $300.0 to $340.0 over the preceding 30 days.
Cigna Group Option Volume And Open Interest Over Last 30 Days
Largest Options Trades Observed:
| Symbol | PUT/CALL | Trade Type | Sentiment | Exp. Date | Ask | Bid | Price | Strike Price | Total Trade Price | Open Interest | Volume |
|---|---|---|---|---|---|---|---|---|---|---|---|
| CI | CALL | TRADE | BEARISH | 01/15/27 | $51.8 | $50.2 | $50.2 | $300.00 | $336.3K | 309 | 70 |
| CI | PUT | SWEEP | BULLISH | 07/18/25 | $13.9 | $12.5 | $12.5 | $315.00 | $108.7K | 1.2K | 500 |
| CI | PUT | SWEEP | BULLISH | 07/18/25 | $14.0 | $12.9 | $12.9 | $315.00 | $96.7K | 1.2K | 581 |
| CI | PUT | SWEEP | BEARISH | 07/18/25 | $12.8 | $12.4 | $12.8 | $315.00 | $64.4K | 1.2K | 631 |
| CI | PUT | TRADE | BEARISH | 07/18/25 | $12.7 | $12.3 | $12.7 | $315.00 | $54.6K | 1.2K | 337 |
About Cigna Group
Cigna primarily provides pharmacy benefit management and health insurance services. Its PBM and specialty pharmacy services, which were greatly expanded by its 2018 merger with Express Scripts, are mostly sold to health insurance plans and employers. Its largest PBM contract is with the Department of Defense (current contract through 2029), and it recently won a multiyear deal with top-tier insurer Centene. In health insurance and other benefits, Cigna primarily serves employers through self-funding arrangements, and the company operates mostly in the US with 17 million US and 2 million international medical members covered as of December 2024.
After a thorough review of the options trading surrounding Cigna Group, we move to examine the company in more detail. This includes an assessment of its current market status and performance.
Cigna Group's Current Market Status
- With a trading volume of 894,988, the price of CI is up by 1.04%, reaching $305.6.
- Current RSI values indicate that the stock is is currently neutral between overbought and oversold.
- Next earnings report is scheduled for 15 days from now.
What Analysts Are Saying About Cigna Group
1 market experts have recently issued ratings for this stock, with a consensus target price of $371.0.
Unusual Options Activity Detected: Smart Money on the Move
Benzinga Edge's Unusual Options board spots potential market movers before they happen. See what positions big money is taking on your favorite stocks. Click here for access.
* Reflecting concerns, an analyst from RBC Capital lowers its rating to Outperform with a new price target of $371.
Options trading presents higher risks and potential rewards. Astute traders manage these risks by continually educating themselves, adapting their strategies, monitoring multiple indicators, and keeping a close eye on market movements. Stay informed about the latest Cigna Group options trades with real-time alerts from Benzinga Pro.