Check Out What Whales Are Doing With AAL

Financial giants have made a conspicuous bullish move on American Airlines Group. Our analysis of options history for American Airlines Group (NASDAQ:AAL) revealed 8 unusual trades.
Delving into the details, we found 75% of traders were bullish, while 25% showed bearish tendencies. Out of all the trades we spotted, 3 were puts, with a value of $105,035, and 5 were calls, valued at $261,791.
Predicted Price Range
Based on the trading activity, it appears that the significant investors are aiming for a price territory stretching from $8.0 to $12.0 for American Airlines Group over the recent three months.
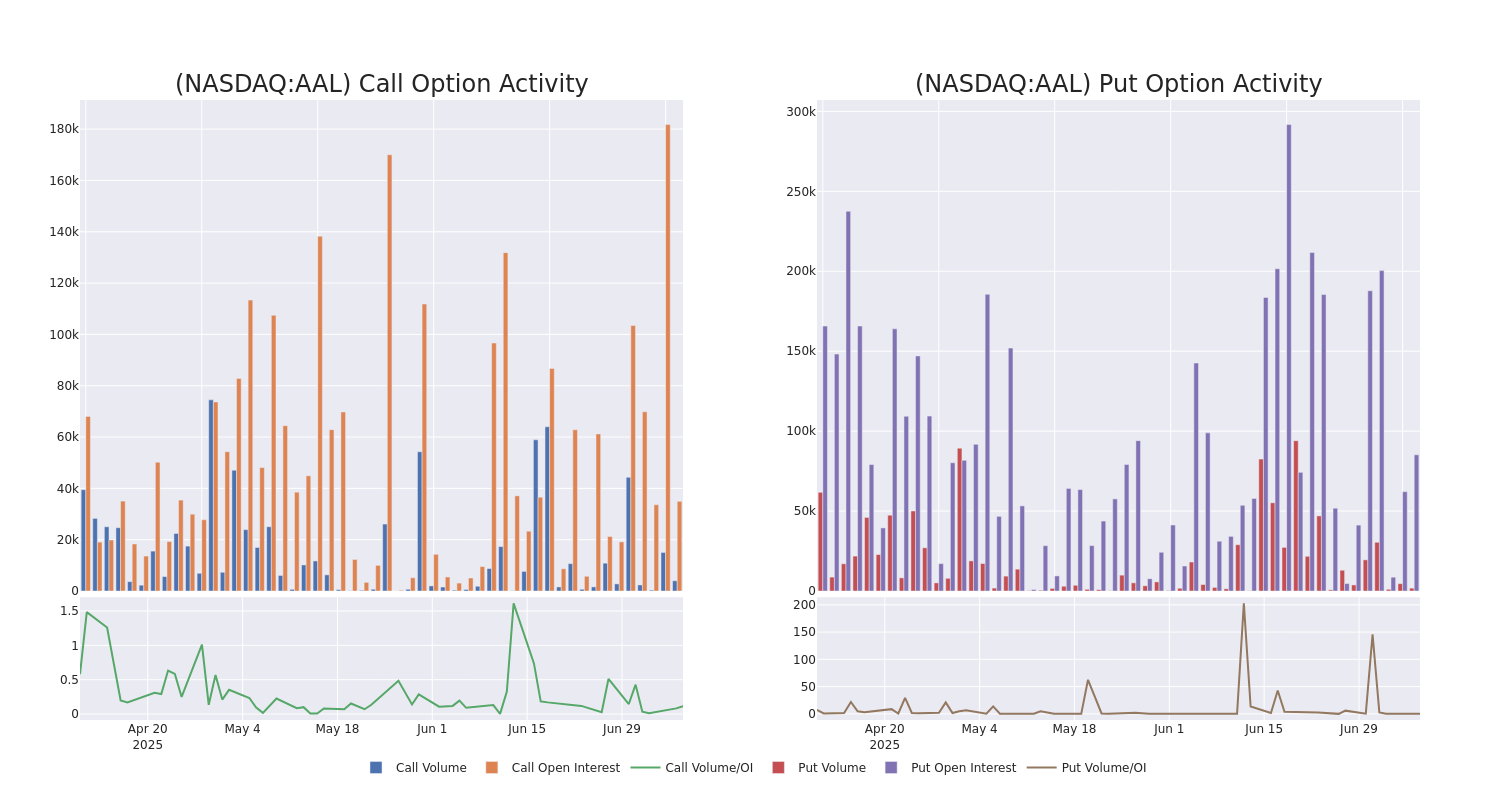
Volume & Open Interest Development
Looking at the volume and open interest is a powerful move while trading options. This data can help you track the liquidity and interest for American Airlines Group's options for a given strike price. Below, we can observe the evolution of the volume and open interest of calls and puts, respectively, for all of American Airlines Group's whale trades within a strike price range from $8.0 to $12.0 in the last 30 days.
American Airlines Group Call and Put Volume: 30-Day Overview
Noteworthy Options Activity:
| Symbol | PUT/CALL | Trade Type | Sentiment | Exp. Date | Ask | Bid | Price | Strike Price | Total Trade Price | Open Interest | Volume |
|---|---|---|---|---|---|---|---|---|---|---|---|
| AAL | CALL | SWEEP | BULLISH | 01/16/26 | $1.72 | $1.68 | $1.7 | $12.00 | $102.1K | 33.9K | 986 |
| AAL | CALL | TRADE | BULLISH | 01/16/26 | $1.7 | $1.67 | $1.7 | $12.00 | $51.0K | 33.9K | 1.4K |
| AAL | CALL | TRADE | BULLISH | 01/16/26 | $1.7 | $1.67 | $1.7 | $12.00 | $51.0K | 33.9K | 385 |
| AAL | PUT | SWEEP | BULLISH | 01/16/26 | $1.76 | $1.58 | $1.58 | $12.00 | $46.6K | 57.3K | 1.1K |
| AAL | CALL | SWEEP | BEARISH | 01/16/26 | $1.7 | $1.69 | $1.69 | $12.00 | $31.6K | 33.9K | 1.1K |
About American Airlines Group
American Airlines is the world's largest airline by aircraft, capacity, and scheduled revenue passenger miles. Its major US hubs are Charlotte, Chicago, Dallas/Fort Worth, Los Angeles, Miami, New York, Philadelphia, Phoenix, and Washington, D.C. It generates over 30% of US airline revenue connecting Latin America with destinations in the United States. After completing a major fleet renewal, the company has the youngest fleet of US legacy carriers.
Present Market Standing of American Airlines Group
- With a volume of 3,865,159, the price of AAL is up 2.33% at $11.86.
- RSI indicators hint that the underlying stock may be approaching overbought.
- Next earnings are expected to be released in 16 days.
What Analysts Are Saying About American Airlines Group
Over the past month, 2 industry analysts have shared their insights on this stock, proposing an average target price of $12.0.
Unusual Options Activity Detected: Smart Money on the Move
Benzinga Edge's Unusual Options board spots potential market movers before they happen. See what positions big money is taking on your favorite stocks. Click here for access.
* An analyst from B of A Securities persists with their Neutral rating on American Airlines Group, maintaining a target price of $12.
* An analyst from UBS persists with their Neutral rating on American Airlines Group, maintaining a target price of $12.
Options trading presents higher risks and potential rewards. Astute traders manage these risks by continually educating themselves, adapting their strategies, monitoring multiple indicators, and keeping a close eye on market movements. Stay informed about the latest American Airlines Group options trades with real-time alerts from Benzinga Pro.