In-Depth Analysis: Apple Versus Competitors In Technology Hardware, Storage & Peripherals Industry

In today's rapidly changing and fiercely competitive business landscape, it is vital for investors and industry enthusiasts to carefully evaluate companies. In this article, we will perform a comprehensive industry comparison, evaluating Apple (NASDAQ:AAPL) against its key competitors in the Technology Hardware, Storage & Peripherals industry. By analyzing important financial metrics, market position, and growth prospects, we aim to provide valuable insights for investors and shed light on company's performance within the industry.
FREE Event: The Man Who Called NVIDIA at $10 Goes Live Wednesday
While most investors chase yesterday's headlines, Tim Melvin spots tomorrow's winners. See the exact system that found NVIDIA before it exploded 10X, plus legendary options trader Anne-Marie Baiynd reveals how to multiply those gains. [Reserve Your Free Spot]
Apple Background
Apple is among the largest companies in the world, with a broad portfolio of hardware and software products targeted at consumers and businesses. Apple's iPhone makes up a majority of the firm sales, and Apple's other products like Mac, iPad, and Watch are designed around the iPhone as the focal point of an expansive software ecosystem. Apple has progressively worked to add new applications, like streaming video, subscription bundles, and augmented reality. The firm designs its own software and semiconductors while working with subcontractors like Foxconn and TSMC to build its products and chips. Slightly less than half of Apple's sales come directly through its flagship stores, with a majority of sales coming indirectly through partnerships and distribution.
| Company | P/E | P/B | P/S | ROE | EBITDA (in billions) | Gross Profit (in billions) | Revenue Growth |
|---|---|---|---|---|---|---|---|
| Apple Inc | 30.47 | 43.75 | 7.43 | 37.11% | $32.25 | $44.87 | 5.08% |
| Super Micro Computer Inc | 23.43 | 4.03 | 1.26 | 1.72% | $0.14 | $0.44 | 19.48% |
| Hewlett Packard Enterprise Co | 17.21 | 0.98 | 0.76 | -4.4% | $0.87 | $2.17 | 5.87% |
| NetApp Inc | 18.20 | 19.88 | 3.28 | 33.42% | $0.43 | $1.19 | 3.84% |
| Western Digital Corp | 20.06 | 3.95 | 1.32 | 5.86% | $0.28 | $0.91 | 30.94% |
| Pure Storage Inc | 137.82 | 13.76 | 5.53 | -1.1% | $0.04 | $0.54 | 12.26% |
| Eastman Kodak Co | 12.12 | 0.84 | 0.50 | -1.66% | $0.02 | $0.05 | -0.8% |
| Turtle Beach Corp | 17.64 | 2.18 | 0.72 | -0.55% | $0.0 | $0.02 | 14.42% |
| Average | 35.21 | 6.52 | 1.91 | 4.76% | $0.25 | $0.76 | 12.29% |
Through a detailed examination of Apple, we can deduce the following trends:
-
The Price to Earnings ratio of 30.47 is 0.87x lower than the industry average, indicating potential undervaluation for the stock.
-
The elevated Price to Book ratio of 43.75 relative to the industry average by 6.71x suggests company might be overvalued based on its book value.
-
The Price to Sales ratio of 7.43, which is 3.89x the industry average, suggests the stock could potentially be overvalued in relation to its sales performance compared to its peers.
-
The Return on Equity (ROE) of 37.11% is 32.35% above the industry average, highlighting efficient use of equity to generate profits.
-
The Earnings Before Interest, Taxes, Depreciation, and Amortization (EBITDA) of $32.25 Billion is 129.0x above the industry average, highlighting stronger profitability and robust cash flow generation.
-
Compared to its industry, the company has higher gross profit of $44.87 Billion, which indicates 59.04x above the industry average, indicating stronger profitability and higher earnings from its core operations.
-
The company is witnessing a substantial decline in revenue growth, with a rate of 5.08% compared to the industry average of 12.29%, which indicates a challenging sales environment.
Debt To Equity Ratio
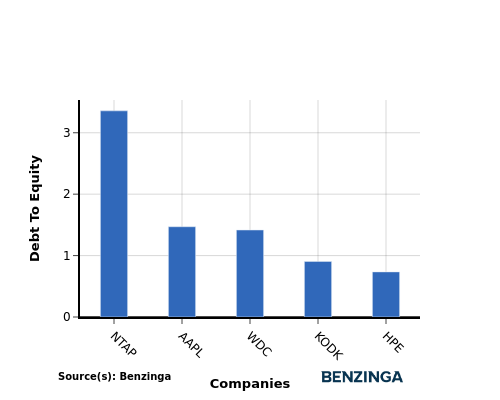
The debt-to-equity (D/E) ratio helps evaluate the capital structure and financial leverage of a company.
Considering the debt-to-equity ratio in industry comparisons allows for a concise evaluation of a company's financial health and risk profile, aiding in informed decision-making.
By considering the Debt-to-Equity ratio, Apple can be compared to its top 4 peers, leading to the following observations:
-
When evaluating the debt-to-equity ratio, Apple is in the middle position among its top 4 peers.
-
The company maintains a moderate level of debt relative to its equity with a debt-to-equity ratio of 1.47, suggesting a relatively balanced financial structure.
Key Takeaways
For Apple in the Technology Hardware, Storage & Peripherals industry, the PE ratio is low compared to peers, indicating potential undervaluation. The PB and PS ratios are high, suggesting overvaluation relative to industry standards. In terms of ROE, EBITDA, gross profit, and revenue growth, Apple demonstrates strong performance compared to its industry peers, showcasing solid financial health and growth potential.
This article was generated by Benzinga's automated content engine and reviewed by an editor.
The 10X Strategy Revealed - Free Live Event Wednesday
Professional investors don't guess which stocks will explode - they use proven systems to identify them early. See Tim Melvin's 35-year approach plus Anne-Marie Baiynd's strategies for maximizing returns. Live collaboration for the first time ever. [Register Free]
Posted-In: BZI-IANews Markets Trading Ideas