Preview: Microsoft's Earnings
Microsoft (NASDAQ:MSFT) is preparing to release its quarterly earnings on Wednesday, 2025-07-30. Here's a brief overview of what investors should keep in mind before the announcement.
Analysts expect Microsoft to report an earnings per share (EPS) of $3.37.
Anticipation surrounds Microsoft's announcement, with investors hoping to hear about both surpassing estimates and receiving positive guidance for the next quarter.
New investors should understand that while earnings performance is important, market reactions are often driven by guidance.
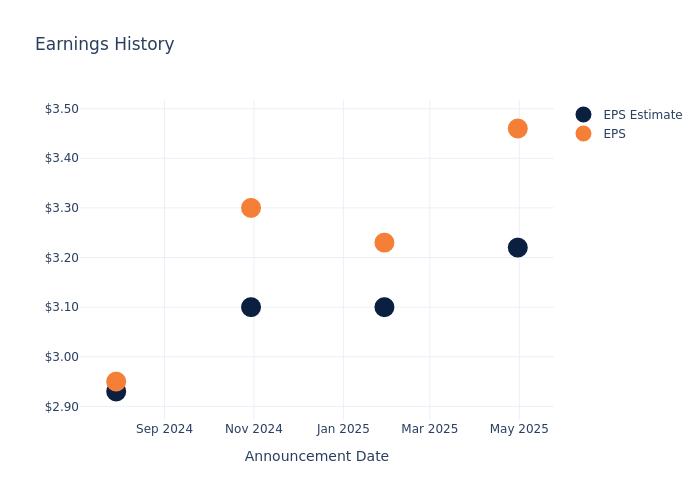
Historical Earnings Performance
In the previous earnings release, the company beat EPS by $0.24, leading to a 7.63% increase in the share price the following trading session.
Here's a look at Microsoft's past performance and the resulting price change:
| Quarter | Q3 2025 | Q2 2025 | Q1 2025 | Q4 2024 |
|---|---|---|---|---|
| EPS Estimate | 3.22 | 3.10 | 3.1 | 2.93 |
| EPS Actual | 3.46 | 3.23 | 3.3 | 2.95 |
| Price Change % | 8.0% | -6.0% | -6.0% | -1.0% |
Stock Performance
Shares of Microsoft were trading at $512.5 as of July 28. Over the last 52-week period, shares are up 23.4%. Given that these returns are generally positive, long-term shareholders should be satisfied going into this earnings release.
Analyst Insights on Microsoft
For investors, grasping market sentiments and expectations in the industry is vital. This analysis explores the latest insights regarding Microsoft.
Microsoft has received a total of 40 ratings from analysts, with the consensus rating as Outperform. With an average one-year price target of $540.42, the consensus suggests a potential 5.45% upside.
Analyzing Analyst Ratings Among Peers
The analysis below examines the analyst ratings and average 1-year price targets of Oracle, ServiceNow and Palo Alto Networks, three significant industry players, providing valuable insights into their relative performance expectations and market positioning.
- Analysts currently favor an Buy trajectory for Oracle, with an average 1-year price target of $224.53, suggesting a potential 56.19% downside.
- Analysts currently favor an Outperform trajectory for ServiceNow, with an average 1-year price target of $1132.9, suggesting a potential 121.05% upside.
- Analysts currently favor an Outperform trajectory for Palo Alto Networks, with an average 1-year price target of $215.4, suggesting a potential 57.97% downside.
Peers Comparative Analysis Summary
The peer analysis summary outlines pivotal metrics for Oracle, ServiceNow and Palo Alto Networks, demonstrating their respective standings within the industry and offering valuable insights into their market positions and comparative performance.
| Company | Consensus | Revenue Growth | Gross Profit | Return on Equity |
|---|---|---|---|---|
| Microsoft | Outperform | 13.27% | $48.15B | 8.27% |
| Oracle | Buy | 11.31% | $11.16B | 18.43% |
| ServiceNow | Outperform | 22.38% | $2.49B | 3.65% |
| Palo Alto Networks | Outperform | 15.33% | $1.67B | 3.85% |
Key Takeaway:
Microsoft is positioned at the top for Revenue Growth among its peers. It ranks in the middle for Gross Profit. Microsoft is at the bottom for Return on Equity.
Delving into Microsoft's Background
Microsoft develops and licenses consumer and enterprise software. It is known for its Windows operating systems and Office productivity suite. The company is organized into three equally sized broad segments: productivity and business processes (legacy Microsoft Office, cloud-based Office 365, Exchange, SharePoint, Skype, LinkedIn, Dynamics), intelligence cloud (infrastructure- and platform-as-a-service offerings Azure, Windows Server OS, SQL Server), and more personal computing (Windows Client, Xbox, Bing search, display advertising, and Surface laptops, tablets, and desktops).
Financial Milestones: Microsoft's Journey
Market Capitalization: Exceeding industry standards, the company's market capitalization places it above industry average in size relative to peers. This emphasizes its significant scale and robust market position.
Positive Revenue Trend: Examining Microsoft's financials over 3 months reveals a positive narrative. The company achieved a noteworthy revenue growth rate of 13.27% as of 31 March, 2025, showcasing a substantial increase in top-line earnings. As compared to its peers, the company achieved a growth rate higher than the average among peers in Information Technology sector.
Net Margin: Microsoft's financial strength is reflected in its exceptional net margin, which exceeds industry averages. With a remarkable net margin of 36.86%, the company showcases strong profitability and effective cost management.
Return on Equity (ROE): Microsoft's ROE surpasses industry standards, highlighting the company's exceptional financial performance. With an impressive 8.27% ROE, the company effectively utilizes shareholder equity capital.
Return on Assets (ROA): Microsoft's ROA excels beyond industry benchmarks, reaching 4.71%. This signifies efficient management of assets and strong financial health.
Debt Management: With a below-average debt-to-equity ratio of 0.19, Microsoft adopts a prudent financial strategy, indicating a balanced approach to debt management.
To track all earnings releases for Microsoft visit their earnings calendar on our site.
This article was generated by Benzinga's automated content engine and reviewed by an editor.