Earnings Preview For Ally Financial

Ally Financial (NYSE:ALLY) is gearing up to announce its quarterly earnings on Friday, 2025-07-18. Here's a quick overview of what investors should know before the release.
Analysts are estimating that Ally Financial will report an earnings per share (EPS) of $0.79.
The announcement from Ally Financial is eagerly anticipated, with investors seeking news of surpassing estimates and favorable guidance for the next quarter.
It's worth noting for new investors that guidance can be a key determinant of stock price movements.
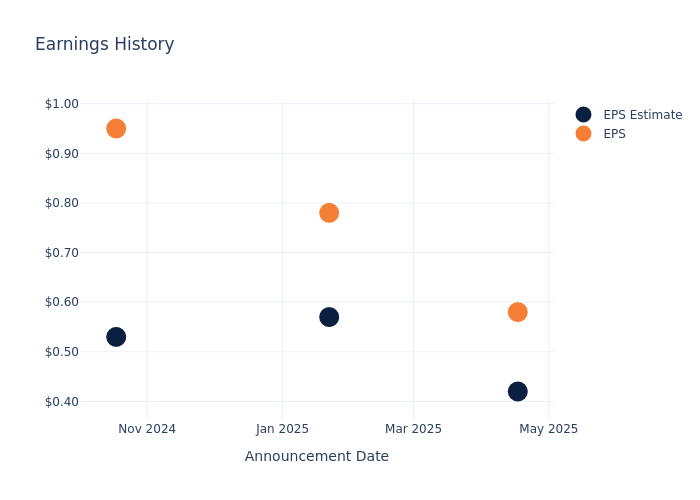
Historical Earnings Performance
During the last quarter, the company reported an EPS beat by $0.16, leading to a 0.0% drop in the share price on the subsequent day.
Here's a look at Ally Financial's past performance and the resulting price change:
| Quarter | Q1 2025 | Q4 2024 | Q3 2024 | Q2 2024 |
|---|---|---|---|---|
| EPS Estimate | 0.42 | 0.57 | 0.53 | 0.64 |
| EPS Actual | 0.58 | 0.78 | 0.95 | 0.97 |
| Price Change % | -2.0% | 1.0% | -2.0% | -2.0% |
Performance of Ally Financial Shares
Shares of Ally Financial were trading at $39.33 as of July 16. Over the last 52-week period, shares are down 4.95%. Given that these returns are generally negative, long-term shareholders are likely a little upset going into this earnings release.
Insights Shared by Analysts on Ally Financial
For investors, staying informed about market sentiments and expectations in the industry is paramount. This analysis provides an exploration of the latest insights on Ally Financial.
A total of 7 analyst ratings have been received for Ally Financial, with the consensus rating being Buy. The average one-year price target stands at $43.86, suggesting a potential 11.52% upside.
Comparing Ratings with Competitors
In this analysis, we delve into the analyst ratings and average 1-year price targets of Enova International and Dave, three key industry players, offering insights into their relative performance expectations and market positioning.
- Analysts currently favor an Buy trajectory for Enova International, with an average 1-year price target of $129.5, suggesting a potential 229.27% upside.
- Analysts currently favor an Buy trajectory for Dave, with an average 1-year price target of $234.73, suggesting a potential 496.82% upside.
Snapshot: Peer Analysis
The peer analysis summary provides a snapshot of key metrics for Enova International and Dave, illuminating their respective standings within the industry. These metrics offer valuable insights into their market positions and comparative performance.
| Company | Consensus | Revenue Growth | Gross Profit | Return on Equity |
|---|---|---|---|---|
| Kaspi.kz | Outperform | 48.67% | $430.02B | 15.62% |
| Enova International | Buy | 22.24% | $345.64M | 6.10% |
| Dave | Buy | 46.65% | $100.87M | 15.06% |
Key Takeaway:
Ally Financial ranks at the top for Revenue Growth among its peers. It is in the middle for Gross Profit and Return on Equity.
Unveiling the Story Behind Ally Financial
Formerly the captive financial arm of General Motors, Ally Financial became an independent publicly traded firm in 2014 and is one of the largest consumer auto lenders in the country. While the firm has expanded its product offerings over time, it remains primarily focused on auto lending, with more than 70% of its loan book in consumer auto loans and dealer financing. Ally also offers auto insurance, commercial loans, credit cards, and holds a portfolio of mortgage debt, giving the bank a diversified business model, which includes brokerage services.
Breaking Down Ally Financial's Financial Performance
Market Capitalization Analysis: The company exhibits a lower market capitalization profile, positioning itself below industry averages. This suggests a smaller scale relative to peers.
Revenue Growth: Ally Financial's revenue growth over a period of 3 months has faced challenges. As of 31 March, 2025, the company experienced a revenue decline of approximately -20.15%. This indicates a decrease in the company's top-line earnings. When compared to others in the Financials sector, the company faces challenges, achieving a growth rate lower than the average among peers.
Net Margin: Ally Financial's net margin is below industry standards, pointing towards difficulties in achieving strong profitability. With a net margin of -14.42%, the company may encounter challenges in effective cost control.
Return on Equity (ROE): Ally Financial's ROE lags behind industry averages, suggesting challenges in maximizing returns on equity capital. With an ROE of -2.15%, the company may face hurdles in achieving optimal financial performance.
Return on Assets (ROA): Ally Financial's ROA is below industry standards, pointing towards difficulties in efficiently utilizing assets. With an ROA of -0.13%, the company may encounter challenges in delivering satisfactory returns from its assets.
Debt Management: Ally Financial's debt-to-equity ratio is below industry norms, indicating a sound financial structure with a ratio of 1.6.
To track all earnings releases for Ally Financial visit their earnings calendar on our site.
This article was generated by Benzinga's automated content engine and reviewed by an editor.