An Overview of Interactive Brokers Gr's Earnings

Interactive Brokers Gr (NASDAQ:IBKR) is set to give its latest quarterly earnings report on Thursday, 2025-07-17. Here's what investors need to know before the announcement.
Analysts estimate that Interactive Brokers Gr will report an earnings per share (EPS) of $0.45.
The market awaits Interactive Brokers Gr's announcement, with hopes high for news of surpassing estimates and providing upbeat guidance for the next quarter.
It's important for new investors to understand that guidance can be a significant driver of stock prices.
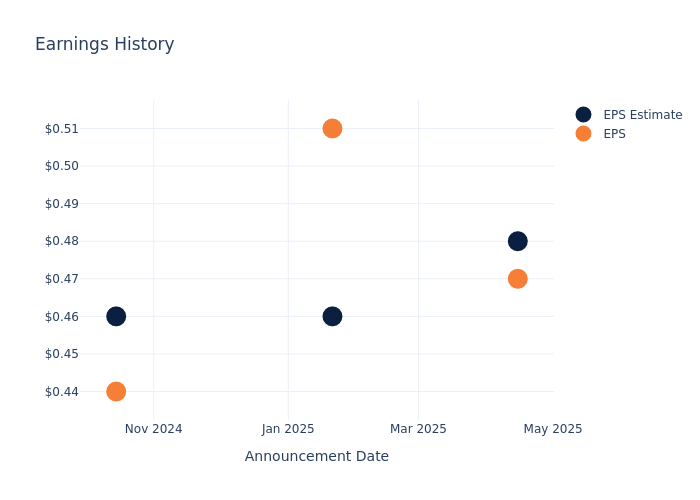
Overview of Past Earnings
Last quarter the company missed EPS by $0.01, which was followed by a 8.95% drop in the share price the next day.
Here's a look at Interactive Brokers Gr's past performance and the resulting price change:
| Quarter | Q1 2025 | Q4 2024 | Q3 2024 | Q2 2024 |
|---|---|---|---|---|
| EPS Estimate | 0.48 | 0.46 | 0.46 | 0.44 |
| EPS Actual | 0.47 | 0.51 | 0.44 | 0.44 |
| Price Change % | -9.0% | 9.0% | -4.0% | -0.0% |
Performance of Interactive Brokers Gr Shares
Shares of Interactive Brokers Gr were trading at $59.63 as of July 15. Over the last 52-week period, shares are up 99.41%. Given that these returns are generally positive, long-term shareholders are likely bullish going into this earnings release.
Analyst Observations about Interactive Brokers Gr
Understanding market sentiments and expectations within the industry is crucial for investors. This analysis delves into the latest insights on Interactive Brokers Gr.
Analysts have given Interactive Brokers Gr a total of 6 ratings, with the consensus rating being Buy. The average one-year price target is $140.83, indicating a potential 136.17% upside.
Understanding Analyst Ratings Among Peers
In this comparison, we explore the analyst ratings and average 1-year price targets of and LPL Finl Hldgs, three prominent industry players, offering insights into their relative performance expectations and market positioning.
- Analysts currently favor an Outperform trajectory for LPL Finl Hldgs, with an average 1-year price target of $437.3, suggesting a potential 633.36% upside.
Analysis Summary for Peers
Within the peer analysis summary, vital metrics for and LPL Finl Hldgs are presented, shedding light on their respective standings within the industry and offering valuable insights into their market positions and comparative performance.
| Company | Consensus | Revenue Growth | Gross Profit | Return on Equity |
|---|---|---|---|---|
| Interactive Brokers Group | Buy | 5.10% | $2.04B | 4.85% |
| LPL Finl Hldgs | Outperform | 29.56% | $966.40M | 10.52% |
Key Takeaway:
Interactive Brokers Group ranks higher than its peer in terms of Revenue Growth and Gross Profit, indicating stronger performance in these areas. However, its peer outperforms in terms of Return on Equity. Overall, Interactive Brokers Group is positioned favorably compared to its peer based on the provided metrics.
Delving into Interactive Brokers Gr's Background
Interactive Brokers is a large, automated, retail and institutional brokerage that boasted nearly $570 billion in customer equity at the end of 2024. The company cut its teeth as a market maker, introducing US financial markets to automated and algorithmic training before expanding into brokerage services in 1993. The firm has a wide-ranging client base, with its best-in-class order execution and extremely low margin lending rates catering to a sophisticated audience of hedge funds, proprietary traders, and introducing brokers that account for about 45% of the firm's commissions. With operations spanning more than 160 electronic exchanges, 36 countries, and 28 currencies, Interactive Brokers caters to a global clientele, with more than 80% of active accounts sitting outside the US market.
Breaking Down Interactive Brokers Gr's Financial Performance
Market Capitalization Perspectives: The company's market capitalization falls below industry averages, signaling a relatively smaller size compared to peers. This positioning may be influenced by factors such as perceived growth potential or operational scale.
Revenue Growth: Interactive Brokers Gr's revenue growth over a period of 3 months has been noteworthy. As of 31 March, 2025, the company achieved a revenue growth rate of approximately 5.1%. This indicates a substantial increase in the company's top-line earnings. As compared to competitors, the company encountered difficulties, with a growth rate lower than the average among peers in the Financials sector.
Net Margin: Interactive Brokers Gr's net margin is below industry standards, pointing towards difficulties in achieving strong profitability. With a net margin of 9.22%, the company may encounter challenges in effective cost control.
Return on Equity (ROE): The company's ROE is below industry benchmarks, signaling potential difficulties in efficiently using equity capital. With an ROE of 4.85%, the company may need to address challenges in generating satisfactory returns for shareholders.
Return on Assets (ROA): Interactive Brokers Gr's ROA lags behind industry averages, suggesting challenges in maximizing returns from its assets. With an ROA of 0.14%, the company may face hurdles in achieving optimal financial performance.
Debt Management: With a below-average debt-to-equity ratio of 0.0, Interactive Brokers Gr adopts a prudent financial strategy, indicating a balanced approach to debt management.
To track all earnings releases for Interactive Brokers Gr visit their earnings calendar on our site.
This article was generated by Benzinga's automated content engine and reviewed by an editor.