Marsh & McLennan's Earnings: A Preview

Marsh & McLennan (NYSE:MMC) will release its quarterly earnings report on Thursday, 2025-07-17. Here's a brief overview for investors ahead of the announcement.
Analysts anticipate Marsh & McLennan to report an earnings per share (EPS) of $2.67.
Anticipation surrounds Marsh & McLennan's announcement, with investors hoping to hear about both surpassing estimates and receiving positive guidance for the next quarter.
New investors should understand that while earnings performance is important, market reactions are often driven by guidance.
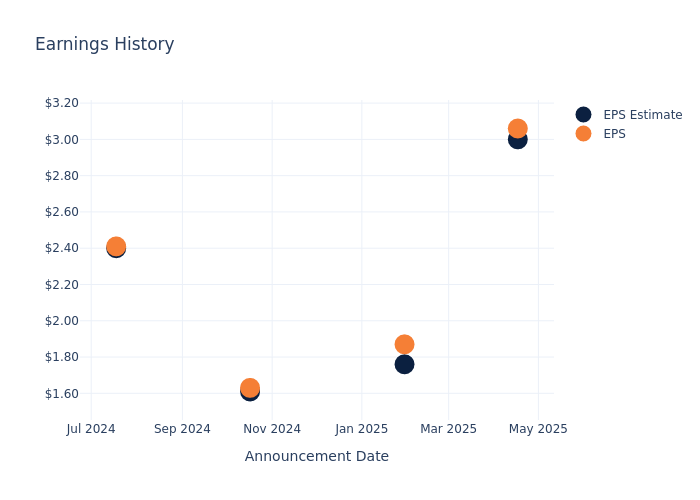
Overview of Past Earnings
During the last quarter, the company reported an EPS beat by $0.06, leading to a 0.0% drop in the share price on the subsequent day.
Here's a look at Marsh & McLennan's past performance and the resulting price change:
| Quarter | Q1 2025 | Q4 2024 | Q3 2024 | Q2 2024 |
|---|---|---|---|---|
| EPS Estimate | 3 | 1.76 | 1.61 | 2.40 |
| EPS Actual | 3.06 | 1.87 | 1.63 | 2.41 |
| Price Change % | -5.0% | -2.0% | -1.0% | -0.0% |
Market Performance of Marsh & McLennan's Stock
Shares of Marsh & McLennan were trading at $210.9 as of July 15. Over the last 52-week period, shares are down 2.16%. Given that these returns are generally negative, long-term shareholders are likely unhappy going into this earnings release.
Analysts' Take on Marsh & McLennan
Understanding market sentiments and expectations within the industry is crucial for investors. This analysis delves into the latest insights on Marsh & McLennan.
The consensus rating for Marsh & McLennan is Neutral, based on 4 analyst ratings. With an average one-year price target of $222.75, there's a potential 5.62% upside.
Comparing Ratings Among Industry Peers
In this comparison, we explore the analyst ratings and average 1-year price targets of Arthur J. Gallagher, Aon and Brown & Brown, three prominent industry players, offering insights into their relative performance expectations and market positioning.
- Analysts currently favor an Neutral trajectory for Arthur J. Gallagher, with an average 1-year price target of $333.8, suggesting a potential 58.27% upside.
- Analysts currently favor an Outperform trajectory for Aon, with an average 1-year price target of $406.71, suggesting a potential 92.84% upside.
- Analysts currently favor an Underperform trajectory for Brown & Brown, with an average 1-year price target of $114.38, suggesting a potential 45.77% downside.
Overview of Peer Analysis
The peer analysis summary provides a snapshot of key metrics for Arthur J. Gallagher, Aon and Brown & Brown, illuminating their respective standings within the industry. These metrics offer valuable insights into their market positions and comparative performance.
| Company | Consensus | Revenue Growth | Gross Profit | Return on Equity |
|---|---|---|---|---|
| Marsh & McLennan Cos | Neutral | 9.08% | $3.21B | 10.08% |
| Arthur J. Gallagher | Neutral | 14.45% | $1.79B | 3.32% |
| Aon | Outperform | 16.19% | $2.48B | 14.70% |
| Brown & Brown | Underperform | 11.96% | $702M | 4.94% |
Key Takeaway:
Marsh & McLennan ranks in the middle among its peers for revenue growth. It is at the top for gross profit and return on equity.
About Marsh & McLennan
Marsh McLennan is a professional services firm that provides advice and solutions in the areas of risk, strategy, and human capital. The company operates through two main segments: risk and insurance services and consulting. In risk and insurance services, the firm offers services via Marsh (an insurance broker) and Guy Carpenter (a risk and reinsurance specialist). The consulting division comprises Mercer (a provider of human resource services) and Oliver Wyman (a management and economic consultancy). About half of its revenue is generated outside the US.
Unraveling the Financial Story of Marsh & McLennan
Market Capitalization: Positioned above industry average, the company's market capitalization underscores its superiority in size, indicative of a strong market presence.
Revenue Growth: Marsh & McLennan displayed positive results in 3 months. As of 31 March, 2025, the company achieved a solid revenue growth rate of approximately 9.08%. This indicates a notable increase in the company's top-line earnings. When compared to others in the Financials sector, the company faces challenges, achieving a growth rate lower than the average among peers.
Net Margin: Marsh & McLennan's financial strength is reflected in its exceptional net margin, which exceeds industry averages. With a remarkable net margin of 19.56%, the company showcases strong profitability and effective cost management.
Return on Equity (ROE): Marsh & McLennan's ROE stands out, surpassing industry averages. With an impressive ROE of 10.08%, the company demonstrates effective use of equity capital and strong financial performance.
Return on Assets (ROA): Marsh & McLennan's financial strength is reflected in its exceptional ROA, which exceeds industry averages. With a remarkable ROA of 2.43%, the company showcases efficient use of assets and strong financial health.
Debt Management: The company faces challenges in debt management with a debt-to-equity ratio higher than the industry average. With a ratio of 1.59, caution is advised due to increased financial risk.
To track all earnings releases for Marsh & McLennan visit their earnings calendar on our site.
This article was generated by Benzinga's automated content engine and reviewed by an editor.