Expert Explains How To Play Merck In 2 Charts
JC Parets, Market Technician and founder of Eagle Bay Capital keeps track of the movement and performance of the Dow 30 stocks, looking into the companies every week.
In its most recent Dow 30 report, the firm provides some insight on Merck & Co., Inc. (NYSE: MRK).
Weekly Chart
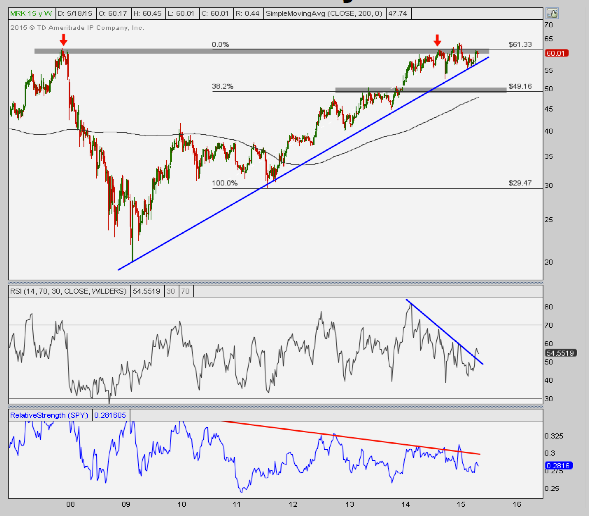
Although Merck has been structurally “nice” for years, the stock ran up towards historic resistance levels. “Last time MRK was up here, the stock fell by almost 70% over the next year,” Parets highlights. “This had given the bears the more favorable risk/reward since last summer.”
“On a relative basis prices are breaking out nicely and now momentum is trying to confirm new highs, which would be a positive,” he adds.
Related Link: Pedone: Twitter, Alibaba Are 'Solid' Setups
Eagle Bay has said all along that they would only want to be long Merck if the stock was above the 2007 highs. Below those levels, they don’t see any reason to be long.
Nonetheless, if the stock can hold above the 2007 highs, “this could represent a massive breakout structurally that would call for significantly higher prices this year,” Parets states, while he recommends to keep waiting.
Daily Chart
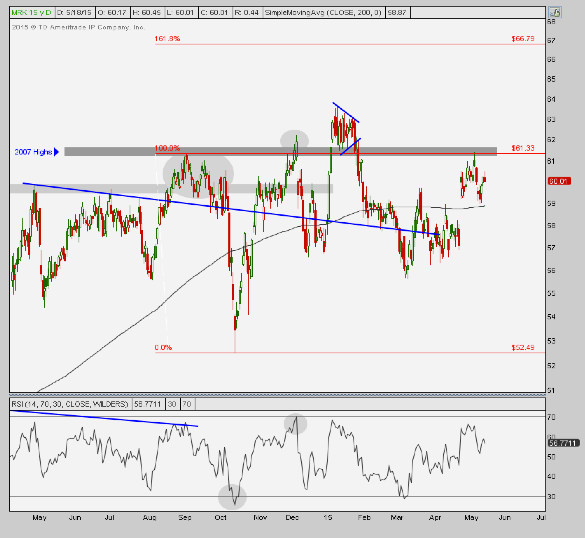
Short-term, the firm only wants to be long Merck if the stock is above the 2007 highs, which were also hit last September, before the stock rolled over.
“With a rising 200 day moving average and momentum in a bullish range, this had been a name where we wanted to err on the bullish side,” the expert expounds. “But now the 200 day is flat and momentum is in a bearish range, invalidating any of these bullish developments.”
From a risk management perspective, the firm sees no reason to be long below the gray shaded area in the chart, which represents the September highs. Above that area, however, they want to be “aggressive buyers with a target up near 67 based on the 161.8% Fibonacci extension of the September/October correction.”
“When this bullish consolidation in January resolved bearishly and not to the upside it set the stage for further decline. With a flat 200 day moving average I still see little to do here and would continue to wait for this to develop,” Parets concludes.
© 2025 Benzinga.com. Benzinga does not provide investment advice. All rights reserved.
Posted-In: Dow 30 Eagle Bay JC ParetsAnalyst Color Biotech Technicals Trading Ideas